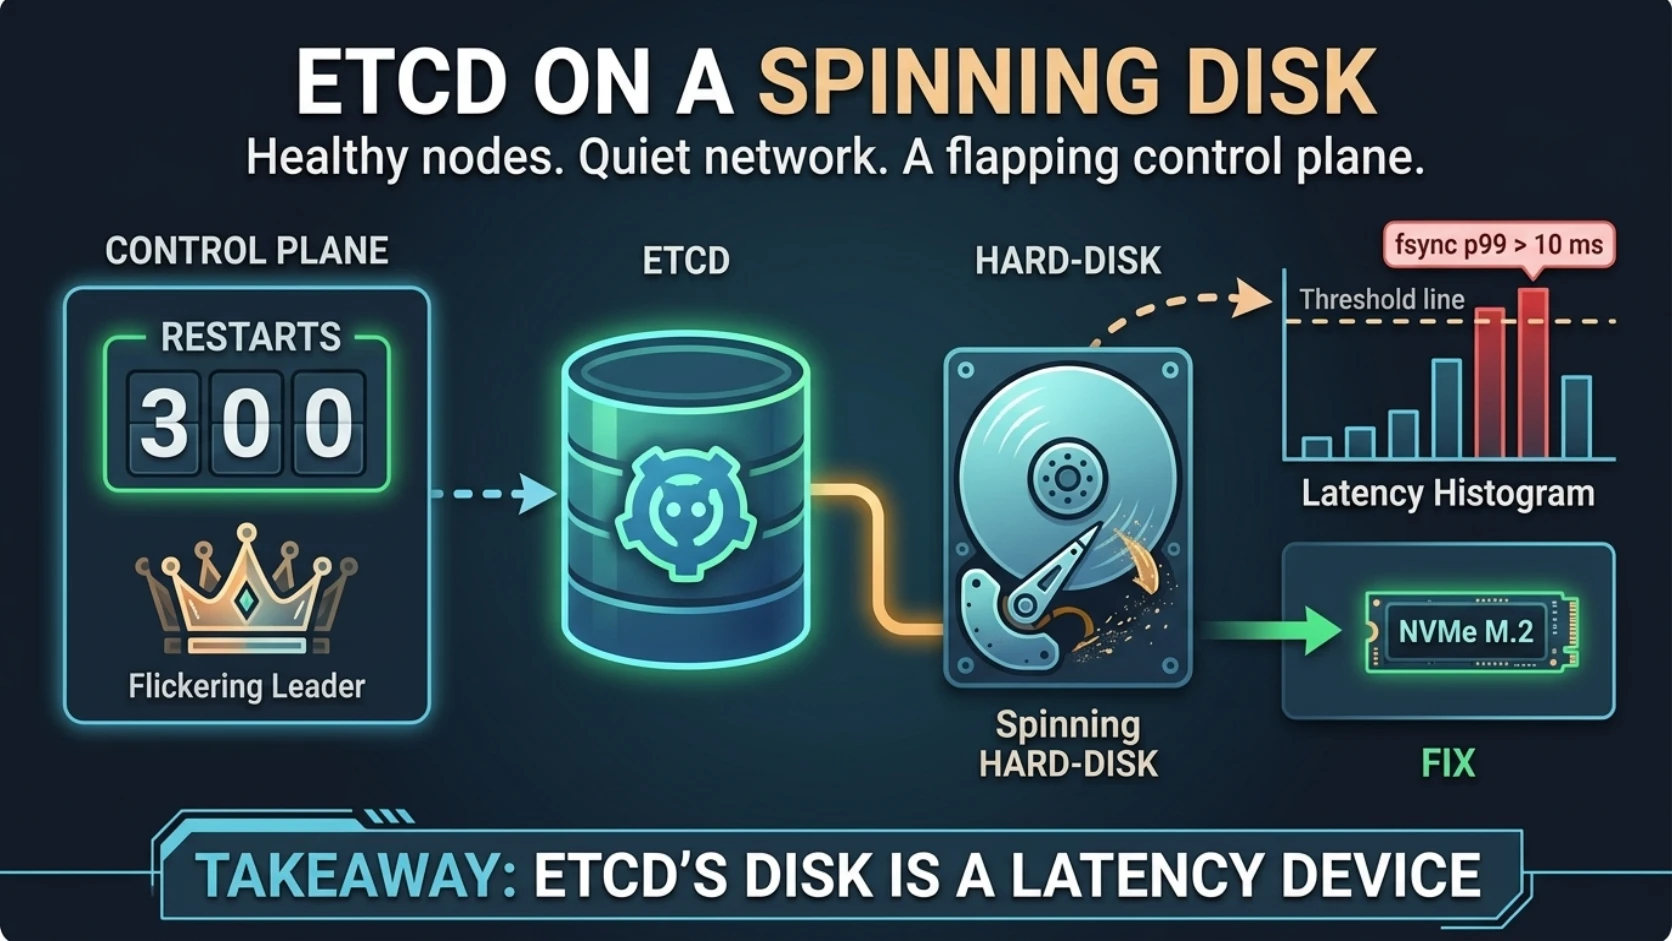
The control plane was flapping because of a spinning disk
The control plane was flapping because of a spinning disk
The nodes were healthy. The network was fine. Memory was fine, CPU was fine, every
component reported Healthy.
The controller manager had restarted 307 times in under three days. The scheduler, 300.
etcd was on rust.
I'd looked at this cluster before and written it down as "chronic but mild: about 139 restarts over 202 days." That number was real. It was also a lifetime average, measured before a host reboot quietly recreated the pods, and it hid a current rate of roughly a hundred restarts a day. My own notes were the first thing that lied to me in this story.
What was actually happening
AcmeCo runs a single control-plane node, control-1, as a VM on a Proxmox host. Its virtual
disk sat on a pool of rotational drives shared with the workers. etcd's data directory
lived on the root volume, alongside everything else.
Here's the chain, and every link in it is working as designed:
- etcd has to
fdatasyncits write-ahead log before it acknowledges a write. - On a busy spinning disk, that sync sometimes takes over a second.
- kube-controller-manager and kube-scheduler each hold a leader-election lease. They
renew it by writing a
Leaseobject through the apiserver, with a 5-second timeout. - When etcd can't commit, the renewal times out. The component can't prove it's still leader, so it does the correct thing: it exits.
- Kubelet restarts it. It rejoins, re-lists the world, and adds load to the etcd that was already drowning.
The detail that gave it away: both components lost their lease at the same instant.
leaderelection.go:340] Failed to update lock optimitically: the server was unable to return a response in the time allotted
... context deadline exceeded
failed to renew lease kube-system/kube-controller-manager: timed out waiting for the condition
leaderelection lost
(optimitically is upstream's typo, not mine. Grep for it exactly as spelled.)
Two independent processes don't crash at the same moment because of a bug in each. They crash together because they share a dependency, and the only thing they share is the apiserver, which shares etcd, which shares a disk with every busy worker in the cluster.
The proof
The why was in etcd's own logs:
$ kubectl -n kube-system logs etcd-control-1 --since=6h | grep -c 'took too long'
861
861 slow-apply warnings in six hours. etcd warns when an apply takes longer than 100ms. The worst I found, during a burst of workers rejoining, took 14.5 seconds. And the root of it:
"msg":"slow fdatasync","took":"1.624s","expected-duration":"1s"
On the node itself, lsblk -d -o NAME,ROTA said ROTA=1, and top showed about 33%
iowait. Even at idle, applies were running at 300–680ms against that 100ms budget.
Logs got me to the diagnosis. They're not what you should be watching, though. etcd exports two histograms that measure exactly this, and the thresholds are in the etcd FAQ:
# WAL fsync — p99 should be under 10ms
histogram_quantile(0.99, sum by (le) (rate(etcd_disk_wal_fsync_duration_seconds_bucket[5m])))

# backend commit — p99 should be under 25ms
histogram_quantile(0.99, sum by (le) (rate(etcd_disk_backend_commit_duration_seconds_bucket[5m])))
Ten milliseconds. Our worst logged sync took 1,624.
If you want to know before you build the cluster, fio will tell you. This is the
benchmark the etcd community settled on, because it writes small WAL-sized blocks and syncs
after every one:
mkdir -p /var/lib/etcd-bench
fio --rw=write --ioengine=sync --fdatasync=1 \
    --directory=/var/lib/etcd-bench --size=22m --bs=2300 --name=etcd-check
Ignore the throughput line entirely. Scroll to the fsync/fdatasync/sync_file_range
percentiles and read the 99th. Over 10,000 usec, and etcd will eventually tell you about it
the way it told us.
Why it fooled us
Everything anyone normally checks was green. Idle CPU, spare memory, a disk nowhere near full.
That's the trap. Everyone reads "disk" as a capacity question. How big, how full, how fast in MB/s. A drive that does 150 MB/s sequential looks perfectly fine on every one of those.
etcd doesn't care about any of them. It cares how long one small synchronous write takes, at the 99th percentile, while other things are also writing. A spinning disk under contention is terrible at precisely that, and no dashboard anyone builds by default shows it.
And I had my own contributions:
The stale average. Covered above. A lifetime counter is not a rate. I read a real number that meant something else.
"Zero restarts since the change." The first mitigation was relaxing leader election, and I checked right after, saw zero, and wrote it down as a fix. Nine days later: 69 controller-manager restarts, and the apiserver had restarted 125 times. It was a snapshot, not a result.
"There is no SSD, so moving etcd isn't possible." I wrote that as a constraint. It was a budget line. The operator bought two NVMe drives the following week.
The fixes, in order of what they cost
1. Relax leader election. Cost: nothing. In both static-pod manifests:
- --leader-elect-lease-duration=60s   # default 15s
- --leader-elect-renew-deadline=45s   # default 10s
- --leader-elect-retry-period=5s      # default 2s
This buys tolerance for short stalls. It doesn't make etcd faster. The ~100/day rate dropped to ~8/day, which is better and still bad.
The tempting shortcut is --leader-elect=false. On a single control plane it removes the
failure mode entirely. It also turns into a split-brain landmine the day someone adds a
second control-plane node and forgets the flag. We kept it on.
Editing that manifest also taught me something I'd rather not have learned. Before
the edit I'd saved a backup, kube-controller-manager.yaml.bak, in the same directory.
Kubelet reads every file in the static-pod directory that doesn't start with a dot. The
extension doesn't matter. So it found two pods with the same name, and the stale one won.
The file on disk had 17 flags. The running pod had 15. I spent a confused while checking
the file before I thought to check the pod, which is, word for word, the advice in post 1.
Backups now go in /etc/kubernetes/manifests-backup/.
2. Stop the thing that stalls the disk. Cost: nothing. The apiserver had started getting
killed too: exit 137, reason Error, not OOMKilled, which is its own liveness probe giving
up. At 02:02. The storage layer's daily backup ran at 0 2 * * *, on the same spinning pool,
which is the sort of coincidence that stops being one. We moved the backup to 03:30, clear
of the hourly snapshot and the six-hourly etcd backup, and raised the apiserver probe's
failureThreshold from 8 to 20 (~80s to ~200s of tolerance). A truly wedged apiserver still
gets restarted.
3. Move etcd to NVMe. Cost: money, plus a maintenance window. A mirrored pair of NVMe
drives went in, and control-1 moved onto them.
Two lessons from the move. First, the cluster would not converge while etcd was slow: controllers lose leases, crash, re-list, and add load. Load on the host only fell from 31 to 0.9 once we shut the worker VMs down. Waiting for a quiet moment without stopping the workers is waiting forever.
Second, the obvious Proxmox disk-move copied the full provisioned size, thick, at 4–10
MB/s off contended spinning disks, with an ETA of 4.4 hours. We aborted it and used
zfs send | zfs recv instead, which copies only the blocks actually in use.
After the move:
| on HDD | on NVMe | |
|---|---|---|
| lease update latency | timing out at 5s | 1.5ms idle, 22.9ms under load |
| worst apply, worker-rejoin burst | 14.5s | 106ms |
| control-plane restarts | ~7.7/day, lease-tuned | 0 |
| node Ready after boot | many minutes | 46s |
4. Defragment. Cost: 845 milliseconds. I reported "zero slow applies" after the cutover. That was measured during a quiet window. Over the next 17 hours there were 1,064.
This time it wasn't the disk. NVMe was nearly idle, CPU was 95% idle, and there was plenty of
memory. The time was in process raft request, not fsync. etcdctl endpoint status -w json
showed it:
"dbSize": 96460800, "dbSizeInUse": 32002048
67% of the database was dead space from old revisions that compaction had freed but never
returned. dbSize alone looked small and fine. One etcdctl defrag took 845ms, shrank it to
31.5MB, and slow applies went to zero. Defrag blocks reads and writes on the member while it runs, so on a
single node that's a short pause for the whole API. It fit comfortably inside the liveness tolerance from step 2.
Since then: zero control-plane restarts across weeks. The next time those counters moved, it was because the whole node rebooted.
The checks that actually prove it
- Restart rate, not restart count. Take
restartCountagainst the pod's creation time, or better, a range query. Lifetime counters survive reboots and lie about the present. - Do the restarts line up? If several components lose their leases in the same second, stop debugging the components and go look at what they share.
- p99 of
etcd_disk_wal_fsync_duration_secondsunder 10ms andetcd_disk_backend_commit_duration_secondsunder 25ms. Alert on these, not on disk usage. grep -c 'took too long'over a window that includes real load. A quiet window will tell you whatever you're hoping to hear.- Correlate stalls with cron. Backups, snapshots, and compactions that share the disk are your suspects, and they run on a schedule you can read.
dbSizeInUsevsdbSize, notdbSizealone.- Before the cluster exists:
fiowith--fdatasync=1 --bs=2300, reading the 99th-percentile sync latency, not the throughput. - After a static-pod edit, check the running pod's spec, not the file. And keep nothing else in the manifests directory.
The broader thing, and the reason I think this story travels: most of a Kubernetes cluster can tolerate seconds of latency. Pods take seconds to start. Probes allow seconds. The control plane's consistency layer can't: its budget is a 100ms apply and a 10ms sync, and everything above it is built on an assumption that those budgets hold. Find out which component in your system has a millisecond budget, and put that one on the fast disk.
Rule to steal
Treat etcd's disk as a latency device, not a capacity device. Stop asking how big etcd's disk is. Ask how long one small synced write takes at p99 while the neighbours are busy. If it's over 10ms, fix it before tuning timeouts, because timeouts only decide how long you wait to fail.
Next: The AI-in-production safety playbook — the whole series as one checklist: the six-step loop, the evidence ladder, the secret rules, and the stop conditions.
Comments (0)
Sign in to join the conversation.
No comments yet.